Here is some interesting data from wildcard weekend. Well, some of you might find it interesting anyway.
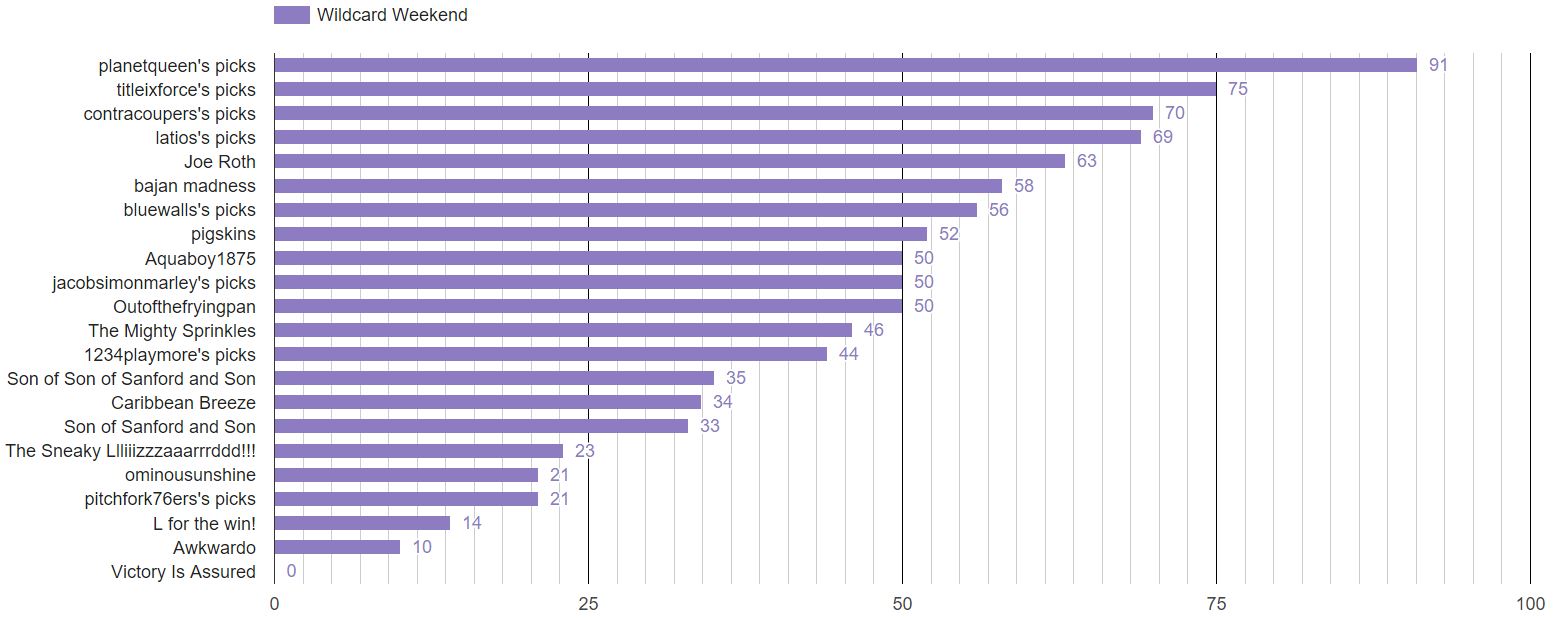
First, the leaderboard. There is a clear leader.
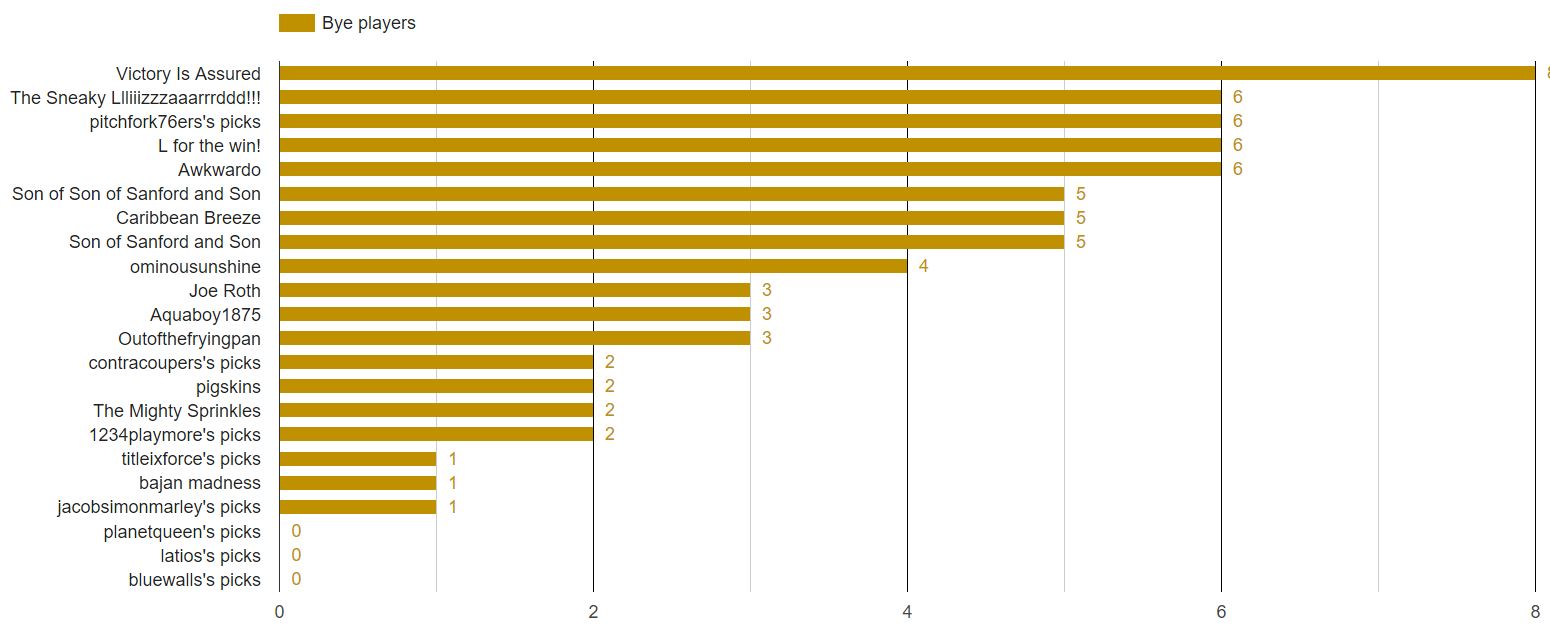
But, many of the teams had bye players. Here’s how many bye players each team had:
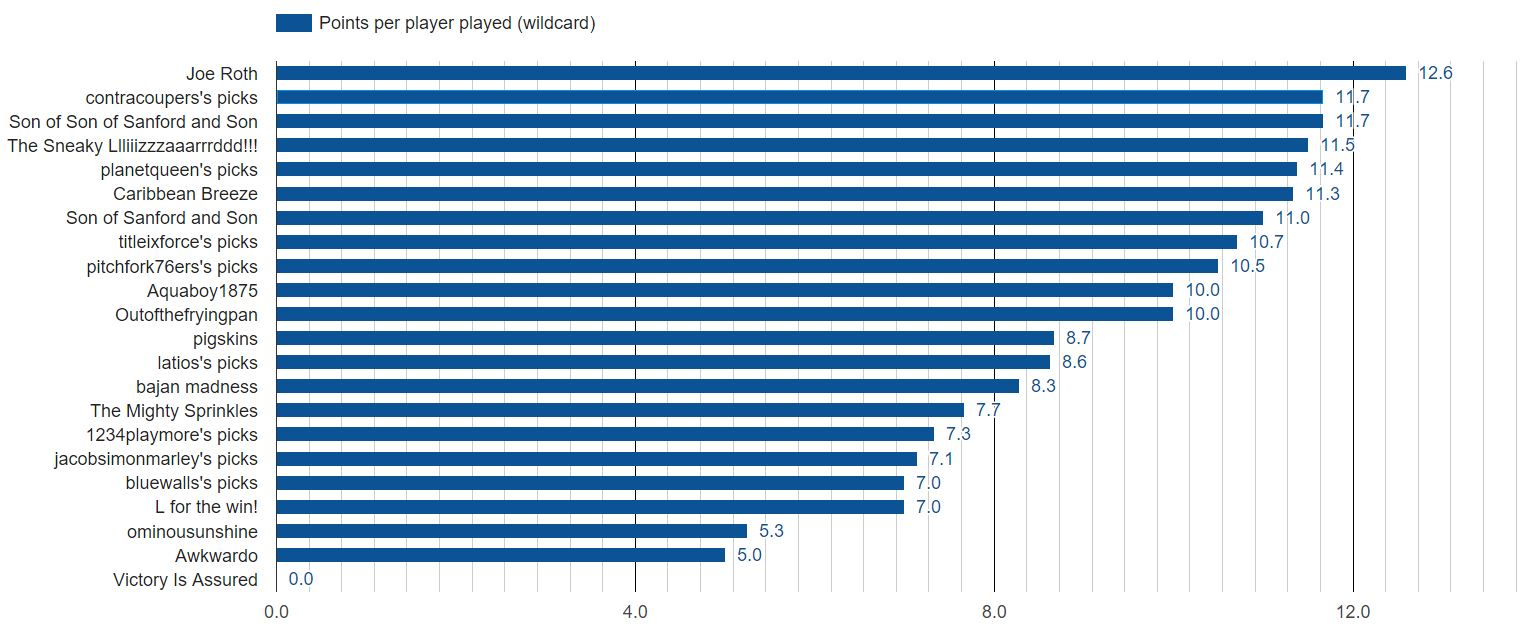
So to see who made the best choices regarding players who actually were on teams that played in a wildcard game, we can look at points per player who played. Here again, we have a clear leader (but not the same one).
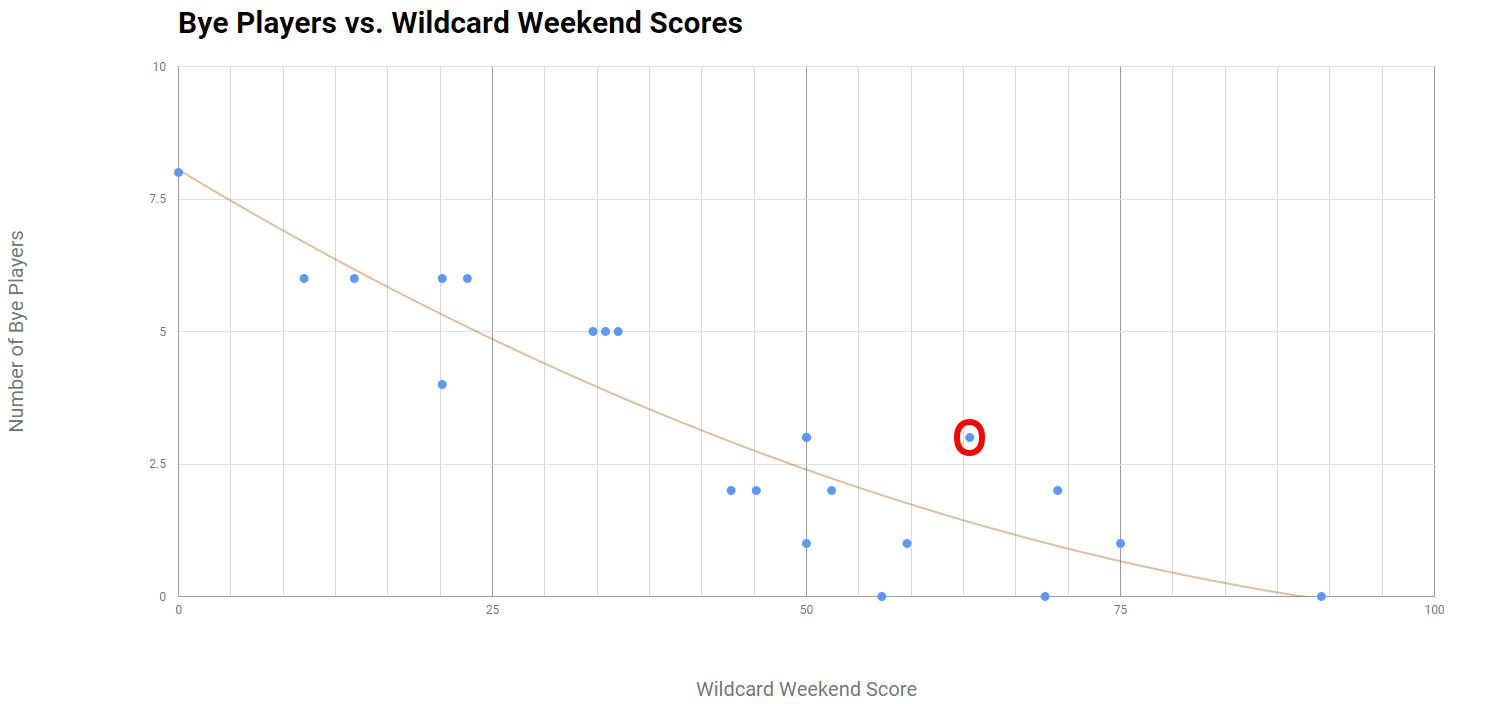
Last, here’s a plot of total points vs. number of bye players. Not surprisingly, it is pretty linear. If you are below the line, you did worse than average. If you are above the line, you did better. That dot with the red circle around it is Joe Roth, who had the highest score per player played in the wildcard round.
If you want to check out the data yourself, click here.